Book Details
See How Graphics Reveal Information
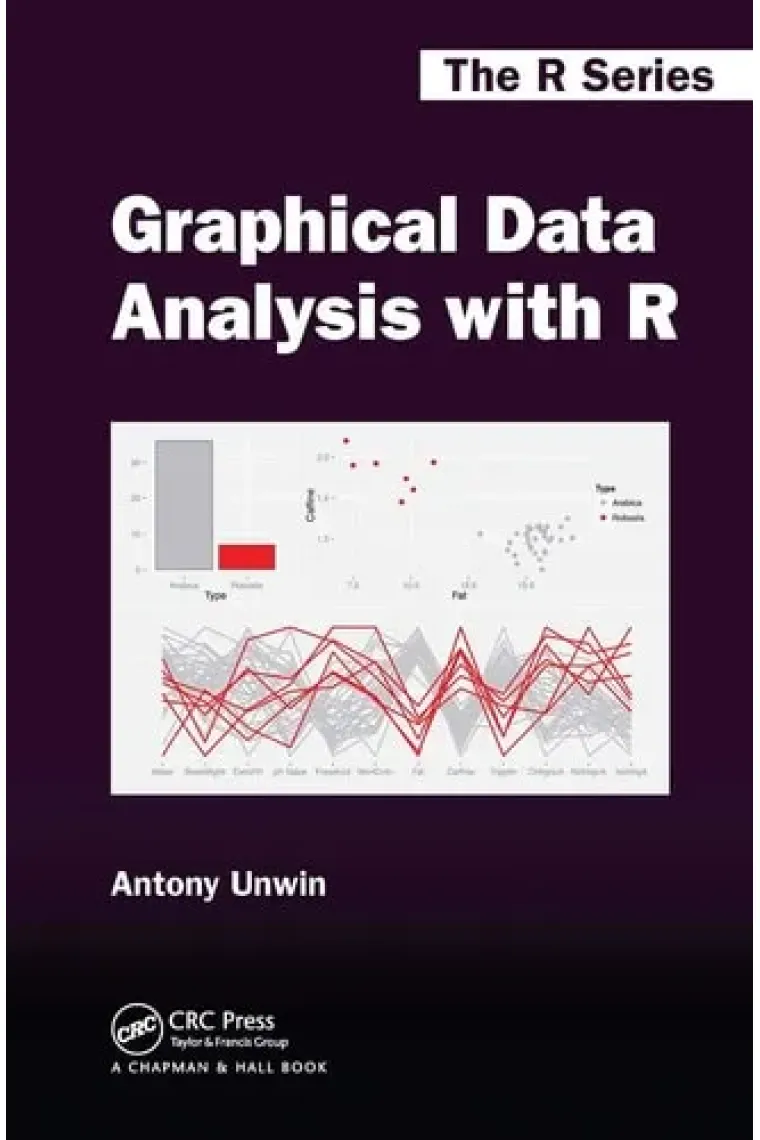
Graphical Data Analysis with R shows you what information you can gain from graphical displays. The book focuses on why you draw graphics to display data and which graphics to draw (and uses R to do so). All the datasets are available in R or one of its packages and the R code is available at rosuda.org/GDA.
Graphical data analysis is useful for data cleaning, exploring data structure, detecting outliers and unusual groups, identifying trends and clusters, spotting local patterns, evaluating modelling output, and presenting results. This book guides you in choosing graphics and understanding what information you can glean from them. It can be used as a primary text in a graphical data analysis course or as a supplement in a statistics course. Colour graphics are used throughout.
- Author Antony (University Of Augsburg) Unwin
- ISBN13 9781032477312
- ISBN10 1032477318
- Pages 310
- Published 2023
- Fecha de publicación 21/01/2023
Reviews and ratings
Be the first to rate it!
Have you read Graphical Data Analysis with R?


Graphical Data Analysis with R
- By
- Antony (University Of Augsburg) Unwin
- |
- ROUTLEDGE (2023)
- 9781032477312


 Thank you for shopping at real bookstores!