Book Details
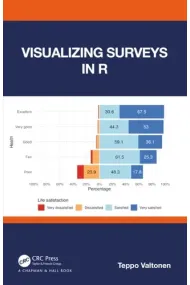
Visualizing Surveys in R is about creating static, print quality figures from survey data using R. The focus is not, for example, on statistical analysis of survey data, but rather on giving concrete solutions for typical problems in visualizing survey data. While there are many excellent books on data visualization, surveys and R, the aim of this book is to bring these topics together, and offer practical instructions for visualizing surveys in R. The key features of Visualizing Surveys in R: Introduction to survey data: variables, categories, and scales Description of a process for visualizing survey data Recommendations for reading survey data into R Advice on building a survey dataset in R to facilitate versatile plotting Step-by-step recipes in R for creating useful plots from survey data Intended for researchers who regularly use surveys and are interested in learning how to seize the vast possibilities and the flexibility of R in survey analysis and visualizations. The book is also valuable for psychologists, marketers, HR personnel, managers and other professionals who wish to standardize and automate the process for visualizing survey data. Finally, the book is suitable as a textbook for courses either more widely on survey studies or more strictly on visualizing survey data in R
Read more - Author Teppo Valtonen
- ISBN13 9781032246970
- ISBN10 1032246979
- Pages 310
- Published 2025
- Fecha de publicación 07/10/2025
Reviews and ratings
Be the first to rate it!
Have you read Visualizing Surveys in R?


Visualizing Surveys in R
- By
- Teppo Valtonen
- |
- ROUTLEDGE (2025)
- 9781032246970
60,61€
63,80€
-5%
Shipping Free
Not available
60,61€
63,80€
-5%
Shipping Free
Not available


Free returns

 Thank you for shopping at real bookstores!